top of page
user experience and information design
 Down-and-out trader limits |  Navigation through trader graphs |
|---|---|
 Viewing a trader's performance |  Performance drill down |
 Holding period drill down |
DAILY RISK REPORTING
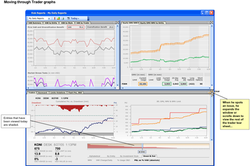
This hedge fund hired Codestreet to design a daily risk reporting tool for senior management. Along with the usual vital signs, they needed a quick rundown on the risk exposure (or lack thereof) of their traders.
The lower section is especially interesting: it shows a kind of 'navigable performance histogram' of all traders' PnL as a percentage of VaR.
This provided an immediate way to determine which traders were playing it too safe, and which ones were in over their head.
bottom of page